INVESTMENT STRATEGIES

Wyckoff Market Cycle Explained: Accumulation, Mark‑Up, Distribution & Markdown
Who Was Wyckoff?
Richard D. Wyckoff was a pioneering trader and market educator in the early 20th century. By studying the actions of large market operators, he developed a framework for understanding how supply and demand drive price cycles. His method emphasises analysing price, volume and the behaviour of what he called the Composite Man; a conceptual figure representing institutional investors who accumulate and distribute positions while disguising their intent. The Wyckoff cycle remains relevant because markets are still moved by liquidity and psychology, and the patterns he described repeat across stocks, commodities and cryptocurrencies.

Overview of the Wyckoff Market Cycle
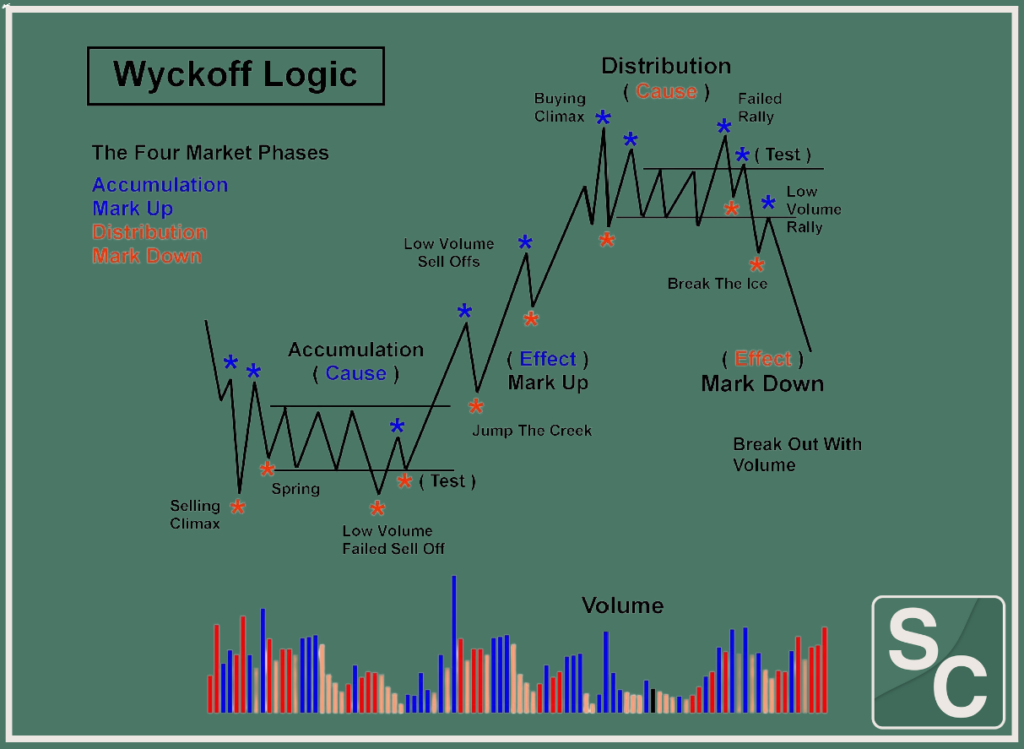
Wyckoff divided market behaviour into four repeating stages:
Stage | Description | Key Dynamics |
Accumulation | Occurs after a downtrend when price moves sideways in a trading range. Big players quietly accumulate positions at low prices while retail traders are fearful. | Low but rising volume; support holds; false breakdowns (springs); sentiment is bearish or apathetic. |
Mark‑Up | Demand overwhelms supply, causing price to break out of the range and trend higher. Resistance levels become support and momentum builds. | Higher highs and higher lows; increasing volume on up moves; retail participation grows; FOMO emerges. |
Distribution | After a strong uptrend, price enters a sideways range as large players unload their holdings. Volume patterns reverse and rallies are weak. | Narrow range with decreasing momentum; false breakouts above resistance (upthrusts); late buyers are trapped; emotions shift from euphoria to disbelief and panic. |
Markdown | Supply exceeds demand, breaking support and sending price into a downtrend. The cycle resets as fear and capitulation dominate. | Lower lows and lower highs; high volume on down moves; widespread panic and forced selling. |
These stages may contain mini re‑accumulations or re‑distributions, but the general sequence remains: sideways → uptrend → sideways → downtrend. The length and volatility of each phase vary across assets and timeframes.
Stage 1 – Accumulation
After a prolonged decline, markets often enter a consolidation range as selling pressure diminishes and smart money begins to accumulate. Accumulation happens when big players buy while price moves sideways and sentiment is weak. Institutional investors gradually acquire assets at undervalued prices; volume increases but the price remains within a horizontal range. Institutions scare off retail traders by creating false breakdowns (springs) to trigger stop‑losses and accumulate shares quietly.
Key signs of accumulation include:
- Sideways trading range: Price oscillates between support and resistance without a clear trend.
- Low but rising volume: Volume contracts during down moves and grows on rallies.
- False breakdowns (springs): Price briefly dips below support before quickly returning to the range, signalling supply absorption. These moves flush out weak holders and allow the Composite Man to buy at favourable prices.
- Higher lows in later sub‑phases: In Wyckoff’s schematic, accumulation is divided into phases A–E. A selling climax (SC), automatic rally (AR) and secondary tests (ST) form the initial range. The spring typically occurs in Phase C, followed by a breakout (Phase D) and clear uptrend (Phase E).
- Psychology: Fear and disbelief dominate. Retail traders are traumatised from the preceding downtrend, while professionals buy quietly. The goal is to accumulate without driving price significantly higher.
Trader Tips for Accumulation
- Look for a trading range after a downtrend and watch for a selling climax with heavy volume followed by an automatic rally and secondary test. These events signal that supply is exhausted.
- Monitor springs and volume spikes on false breakdowns. A quick recovery with high volume indicates absorption by big players.
- Wait for signs of strength, such as a break of the downtrend line and higher highs/lows. Entering during the late accumulation or early mark‑up phase offers the best risk‑reward.
Stage 2 – Mark‑Up
Once accumulation ends, demand overtakes supply and the price breaks above resistance. This is when resistance levels are broken, & volume increases on up days. It’s within these times that price accelerates with sudden volume increases, forming higher highs and higher lows. Specifically within the mark‑up phase, breached resistance becomes support and trading volume continues to soar.
Characteristics of mark‑up:
- Breakout from the trading range: Price closes above the upper bound of accumulation, confirming the start of a new uptrend.
- Higher highs and higher lows: The trend becomes obvious as momentum builds and pullbacks find support at higher levels.
- Increasing volume: Volume expands on up days, confirming demand.
- Participation broadens: Retail traders and the media jump on board. FOMO (fear of missing out) drives additional buying pressure.
- Psychology: Optimism grows as the market rallies. Early buyers from accumulation see gains, while late entrants chase the uptrend. Confidence is high, and scepticism fades.
Trader Tips for Mark-up
- Ride the trend but be mindful of overextension. Scale out of positions into strength and trail stops below new support levels.
- Watch volume and momentum. If volume starts to fall on rallies or the trend slows, it may signal exhaustion and a transition to distribution.
- Remember that mark‑up can include re‑accumulation ranges (sideways consolidations within the uptrend). These often resolve higher and provide additional entry points.
Stage 3 – Distribution
After a sustained rally, the market enters a distribution phase, a sideways range where large participants gradually sell their holdings to late buyers. This is the period when the price peaks, rallies become weak and supply begins to dominate. During the distribution phase, smart money sells assets incrementally while maintaining the illusion of an uptrend; leading to growth slowing, volatility increasing, and false breakouts luring retail traders.
Key features of distribution:
- Sideways trading range near all‑time highs or major resistance.
- Volume contracts overall, but spikes occur during false breakouts (upthrusts) above resistance.
- Lower highs and weaker rallies: Momentum fades; each bounce is less convincing.
- Upthrust After Distribution (UTAD): A sharp false breakout above resistance traps breakout buyers and provides liquidity for large sellers. After this deception, price collapses back into the range, signalling the end of distribution.
- Pattern psychology: Distribution reflects a transition from euphoria to disbelief, denial and panic. Retail traders continue to buy on dips, believing the uptrend will resume, while institutions quietly unload.
Trader Tips for Distribution
- Identify the trading range after a strong rally and watch for failed breakouts. Upthrusts accompanied by heavy volume and rapid reversals are red flags.
- Look for lower highs and declining momentum. If rallies struggle to break resistance and volume falls on up moves, distribution may be underway.
- Confirm with volume: Supply should increase on down moves and decrease on rallies. Use this information to time exits or short entries.
- Beware of re‑distribution: Sideways ranges during downtrends can look like new distribution patterns but are actually continuation structures.
Stage 4 – Markdown
The markdown phase begins when price breaks support and supply overwhelms demand. Once the price falls below the distribution range, a bearish trend emerges with high volume on down days. The prices then will plummet as institutions complete their exits and bearish momentum builds, triggering stop‑losses and accelerating the decline.
Characteristics of markdown:
- Decisive break of support: The lower boundary of distribution fails, and price accelerates downward.
- Series of lower lows and lower highs: The downtrend becomes clear. Rallies are short‑lived and provide opportunities for sellers.
- High volume on declines: Capitulation events create spikes in volume as stop‑losses are triggered and retail traders panic.
- Fear and despair: Sentiment turns negative; news flow is bearish and investors capitulate. This sets the stage for a new accumulation phase, restarting the cycle.
Trader Tips for Mark-down
- Avoid buying too early. Wait for signs of exhaustion such as a selling climax and automatic rally similar to those in accumulation.
- Use stop‑losses to protect capital. Downtrends can be steep and extended.
- Consider scaling in if you plan to accumulate for long‑term positions, but only after the markdown has run its course and signs of accumulation appear.
The Composite Man and Market Psychology
The “Composite Man” is a theoretical, heuristic tool developed by Richard Wyckoff that represents the collective actions of large, professional market participants (institutions, hedge funds, and market makers). It serves as a single entity to model, analyse, and predict market trends by studying volume and price action during accumulation and distribution phases.
This concept reminds traders to think like professionals and assume that market moves are orchestrated by those with deeper pockets and better information. Recognising this helps you avoid reacting emotionally to price swings and instead focus on volume and price structure.
Market psychology plays a critical role:
- Accumulation: Fear and apathy dominate; optimism is scarce.
- Mark‑Up: Optimism and greed grow; FOMO emerges.
- Distribution: Euphoria gives way to denial and disbelief; greed turns to hope and then anxiety.
- Markdown: Fear and panic rule; capitulation cleanses the market and paves the way for the next cycle.
Understanding these emotional shifts helps traders stay objective and align their strategies with the broader market rhythm. Learn more about the “Mistakes of ignoring Market Psychology” here.
Wyckoff Tests – A Quick Checklist
To confirm whether accumulation or distribution is occurring, Wyckoff developed a set of tests. While the full checklist is extensive, here is a simplified version to guide your analysis:
Accumulation (Buying Tests)
- Expected low reached: The asset has likely completed its downtrend.
- Support forms after a selling climax and secondary test.
- Volume rises on rallies and falls on pullbacks.
- Downtrend line broken; higher lows and higher highs emerge.
- Price relative strength: The asset begins outperforming the broader market.
Distribution (Selling Tests)
- Expected high reached: The uptrend has likely topped.
- Volume falls on rallies and rises on reactions.
- Supply appears after a buying climax (sharp surge in price and volume).
- Uptrend line broken; lower highs and lower lows emerge.
- Sideways crown pattern develops; the range resembles a rounded top.
These tests should be used alongside price structure, volume analysis and wider market context. They help filter noise and improve the accuracy of phase identification.
Applying Wyckoff to Crypto Markets
Cryptocurrency markets exhibit many of the same supply‑and‑demand dynamics as stocks, but with important differences:
- Shorter cycles and higher volatility: Crypto markets move faster than traditional markets, so Wyckoff phases may compress into shorter timeframes. False breakouts (springs and upthrusts) are common due to leverage and thin liquidity. ChartGuys notes that crypto often shows rapid UTAD traps because of heavy leverage.
- Altseason rotations: In bull markets, capital flows from Bitcoin into large‑cap altcoins and then into small caps. Understanding where the market is in the Wyckoff cycle can help anticipate these rotations and manage risk.
- Volume data: Not all exchanges report accurate volume. Use multiple data sources and focus on relative changes rather than absolute numbers.
- Tokenomics and fundamentals: Combine Wyckoff analysis with on‑chain metrics, token unlock schedules and project fundamentals to avoid being caught by distribution pumps or markdown collapses.
Final Thoughts
The Wyckoff market cycle offers a powerful lens through which to view market behaviour. By understanding accumulation, mark‑up, distribution and markdown, you gain insight into how institutional players accumulate and distribute assets and how emotion drives retail participation. No method guarantees success, but Wyckoff’s framework can help you align your trading decisions with the broader market structure and avoid emotional pitfalls. Combine this analysis with solid risk management and fundamental research to improve your edge.
WRITTEN & REVIEWED BY Chris Shepley
UPDATED: JULY 2026
Choose your next topic from our Cryptopedia